When Python tests fail, coding agents loop on tracebacks and logs. Retrace captures the failed run, then lets the AI debug backwards from the real runtime values to the root cause. Verify the same replay in VS Code.
Pip install retracesoftware
Free in preview · Open-source record-replay · Python 3.11 & 3.12 · Runs locally or in CI · Verify in VS Code · Backed by PWV
AI debugger for CI failures. Diagnose failed pytest runs from runtime evidence, not guesses.
AI debugger for CI failures
Diagnose failed pytest runs from runtime evidence, not guesses.
Failed runs become artifacts
Keep failed pytest and CI runs as .retrace files.
Runtime values, not just logs
The debugger works from stack frames, variables, and the values from the failed run.
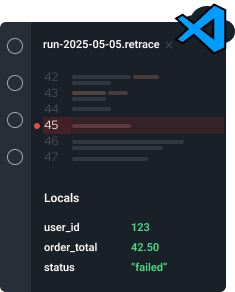
Verify in VS Code
Open the same recording and step through the failed execution yourself.
No test rewrite
Wrap your existing pytest command. No special harness required.
The same recording model works for production failures when you are ready
Recording overhead is under 0.1% on typical web workloads.
See the performance benchmarks
Record-replay, built for Python
Retrace records the non-deterministic parts of a failed run
so the same Python execution replays without rerunning the test.
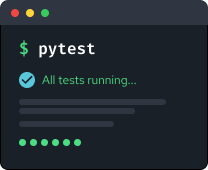
Run pytest under Retrace in CI. If the job passes, discard the recording. If it fails, keep the .retrace artifact.
The Retrace AI debugger inspects the failed run and returns a root-cause diagnosis backed by runtime values. Open the same artifact in VS Code to verify the result yourself.
run: |
mkdir -p recordings
RETRACE_RECORDING=recordings/failed-run.retrace python -m pytest
- name: Upload Retrace recording
if: failure()
uses: actions/upload-artifact@v4
with:
name: retrace-failed-run
path: recordings/failed-run.retrace
source .venv/bin/activate
python -m pip install retracesoftware
No app rewrite required.
RETRACE_RECORDING=recordings/failed-run.retrace \
python -m pytest
If the test passes, discard the recording.
If it fails, keep it.
# Open recordings/failed-run.retrace
# Start replay from the Retrace sidebar
# Step backwards from the failure
No live test process required. You are debugging the recorded execution.
| Today | With Retrace | |
| CI artifacts | CI artifacts are logs and tracebacks | Failed CI runs become replayable artifacts |
| AI agents | AI agents infer from partial context | The AI debugger gets runtime evidence |
| Failure | Stack traces show where Python stopped | Retrace shows the values that led there |
| What gets preserved | Logs show what you predicted would matter | Retrace preserves the failed execution |


run-2025-05-05.retrace
~ Single source of truth

Once the cause is clear, your agent can propose a fix.
& reproducible
offline
artifact
for AI
Retrace does not ask the AI to infer runtime state. It records the failed execution and replays it deterministically, so the debugger inspects the values that actually occurred, not a reconstruction. That is why the diagnosis points to real values at real steps, and why you can verify every one of them.


Replay shows the failed execution. Provenance lets the debugger ask where a value came from.
Retrace's provenance engine traces any value back through the execution — from the point you noticed it, through every transformation, to the original input that caused it.
-
Select any value. Jump to its origin.
Click a variable in the debugger and instantly see the exact line and inputs that produced it.
-
Chain backwards through transformations.
Each origin has its own provenance. Keep drilling back until you reach the root cause.
-
Works on every value, not just outputs.
Intermediate variables, function returns, container mutations — provenance covers everything in the execution.
Now in early access with select design partners.
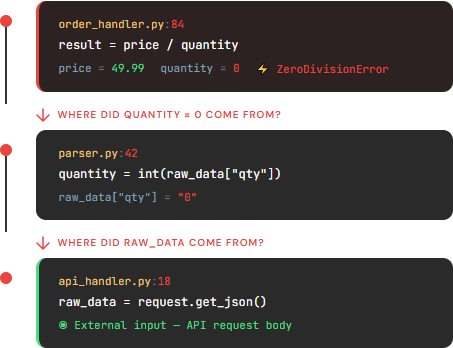
Three clicks from ZeroDivisionError to root cause: the API caller sent qty: "0" in the request body. No manual searching. No log correlation.
Retrace starts with Python CI failures because the value is immediate and the risk is low. The same recording model works for production failures when you are ready: record the execution once, replay it safely, and inspect what actually happened. Recording overhead is under 0.1% on typical web workloads.
How it works
1. Python code
2. Boundary calls
3. .retrace recording
4. Local replay
Perfect for:
- Diagnose failed CI runs with AI.
Diagnose failed pytest and CI runs from the execution that actually failed. No rerun, no guesswork. - Help coding agents debug broken tests.
Give coding agents runtime evidence from the failed run, not just a traceback. - Stabilise flaky tests.
Replay the exact failure to understand non-deterministic behaviour. - Reproduce external dependency failures.
Replay failures involving APIs, databases, files, time, or other external calls. - Investigate after the fact.
Inspect real code paths and runtime state after the process has exited. - Debug production-only failures.
Use the same recording model for production crashes you cannot reproduce locally.
A re-run often takes a different path.
Retrace lets you debug the exact execution that happened, after the fact.
Retrace records the real execution and lets you replay it deterministically, so you can inspect the actual code path and state.
Built by Retrace Software.
Backed by Preston-Werner Ventures.